During the last couple of weeks we’ve been very focused on deeply understanding Cassandra’s write and read paths to build our models the best possible way.
After so much investigation I can summarise which are the steps we follow to assess our model’s performance.
1. Have good practices and anti-patterns always in mind.
Cassandra is known to be a very resilient and highly performant platform, but only so long as you follow the rules and work with the underlying data model.
There are quite a few of these rules so my recommendation is to read through them quickly before thinking of your model.
There are lots of places online where you can read about the good practices to follow and anti-patterns to avoid when data modelling for Cassandra but I have my own repository, here are the links:
- 16 Notes on Cassandra Summit
- Collection of good practices given by Patrick McFadin at last Cassandra Summit EU (2014)
- 16 Notes on Cassandra Summit (II)
- Collection of some more good practices and brand new features to consider. Again from Cassandra Summit EU 2014
- Cassandra Day London 2015
- Collection of some use cases and a very interesting anti-patterns list by Christopher Batey
- Getting Started with Cassandra Time Series data modelling
- Three different patterns you can follow when using Cassandra to store time series
Once you’ve all the ideas fresh in your mind is time to start thinking about your data model.
2. Design your data model and alternatives
Following all the ideas and principles learnt in the previous step, design your data model and try to think of alternatives. These alternatives usually come as minor adjustments that can be applied to the model but just by following the best practices you can’t decide whether one or the other is a better choice.
Here I’ll provide two examples we’ve recently had:
- Having a bucketed time series with a maximum of 86,400 rows per partition, how is it better to read an entire partition?
a) By reading the whole partition at once
b) By reading the whole partition in chunks (2 halves, 4 quarters, …) - Having a model that contains the information of a discretised distribution on each record, how is it better to save the bins?
a) By using a List element that will contain the 100 bins
b) By having 100 columns, one for each bin
The resulting models will meet all the good practices and avoid all the anti-patterns regardless of the final decision so, how do you decide which way to go?
3. Benchmark your alternatives
For this purpose I’ve created a script (Ruby in this case) that:
- Creates the table purposed by the model under test
- Generates PRODUCTION DATA and saves it (memory or disk, depending on the size)
- Benchmarks the applicable access patterns, in our case:
3.1. Insertion of all the data generated in step 2
3.2. Reading of all the data
3.3. Updating the data
It is important that the access patterns are exactly the same way they’ll be in production, otherwise the result of the benchmark is completely useless.
This script should be adapted and ran for every single alternative.
Here you can see the scripts used for both alternatives proposed for the example No. 2 described above:
4. Let data decide
We’re almost there!!
Now we have to collect the data for each execution and compare them to work out which of the candidates is our final model.
There are two sources of data you should look at:
- The output of the script’s execution.
1.1 The script will print an output for every workload benchmarked, (Insert, Read and Update in our example) - The DataStax OpsCenter’s Graphs.
2.1 DataStax OpsCenter is probably the most advanced and easy to use Cassandra monitoring tool.
In our previous example we could see this output from the scripts:
calonso@XXX-XXX-XXX-XXX: bundle exec ruby lists_benchmark.rb
                user     system        total          real
Writing:  133.840000   5.180000   139.020000   (171.499862)
Reading:   24.000000   0.350000    24.350000   ( 47.897192)
Updating:   2.560000   0.210000     2.770000   (  4.135555)

calonso@XXX-XXX-XXX-XXX: bundle exec ruby cols_benchmark.rb
                user     system        total          real
Writing:  133.730000   2.710000   136.440000   (144.749167)
Reading:   30.340000   0.410000    30.750000   ( 41.759687)
Updating:   1.950000   0.090000     2.040000   (  3.020997)
So, we could say that the columns model performs better than the lists based one, but let’s confirm our initial assessment by looking at OpsCenter’s graphs:
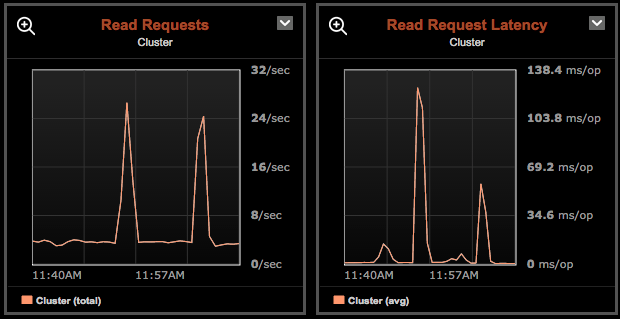
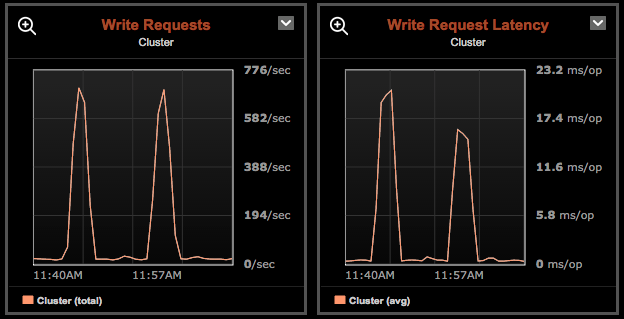
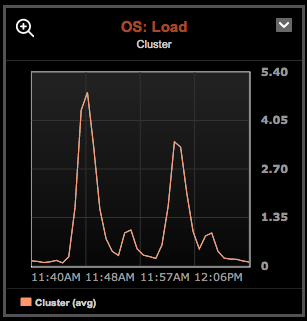
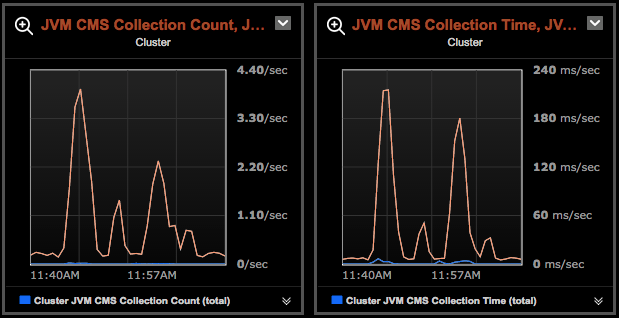
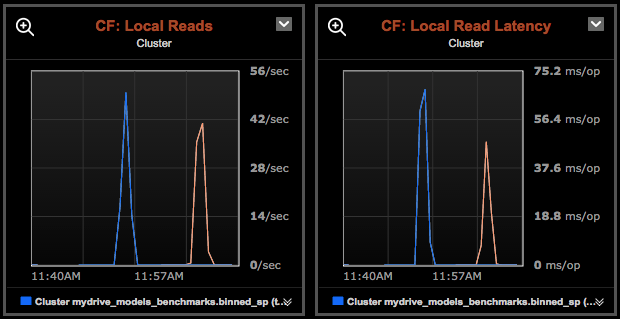
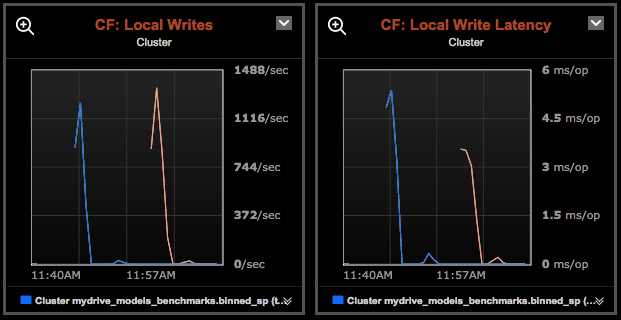
In all the graphs we can see two peaks, the first one was generated during the execution of the lists based model benchmarking and the second one during the columns based one.
Absolutely every graph comparison points towards the columns based model as the one with better performance:
- This graphs show the total reads per second received in the whole cluster on the and coordinator nodes and the average time taken in responding them.
- This graphs show the total writes per second received in the whole cluster on the and coordinator nodes and the average time taken in responding them.
- Average measure of the amount of work a computer performs. A Load of 0 means no work at all, and a load of 1 means 100% of work for a single core, therefore, this value depends on how many cores available. In our deployment = 2.
- Number of times each of the JVM GCs run per second and the time elapsed in each run.
- Total reads per second received on the specific column families being used and the average time taken to respond them.
- Total writes per second received on the specific column families being used and the average time taken to respond them.
And that’s all for us for now!
